A histogram is a graphical display of the colour tones in the picture across the brightness scale. Almost every digital camera (especially DSLRs) have this very useful function. And why is it useful?
Let's take for example the picture below
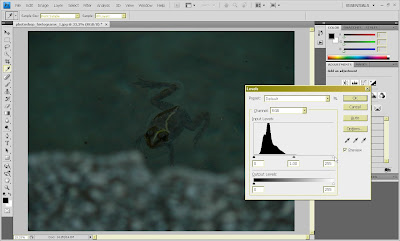
If we open it with Photoshop and hit Ctrl+L (or Image - Adjustments - Levels) a new window with graph will show up looking like this:
We can interpret this histogram like this: the image (just taken out of the camera, without other post-processing) is a little bit dark overall (or underexposed), without having bright colours or highlights. Notice that the graph (looking like a black mountain) is located in the left of the window, meaning that it's the brightness values are low.
To "fix" this photo, we can simply click the Auto button, or we can manually adjust the white arrow below the graph, dragging it to the left until the image looks better.
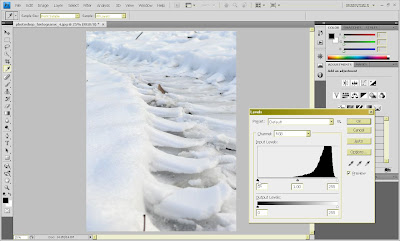
Let's open the next image. The first thing we should notice is that the colour white is predominant, and there are very few dark tonalities (also, there is no black).
This image is slightly overexposed. The histogram is positioned to the right:
To correct this, just push the Auto button, or drag the black slider a little to the right.
A picture correctly exposed will have a histogram looking like this:
Notice that the histogram is well balanced across the darkest and lightest margins.
Tuesday, March 17, 2009
Subscribe to:
Post Comments (Atom)
0 comments:
Post a Comment